No Pain No Gain
I was putting off writing this, because it takes a lot of time to write on this topic, and MUCH longer to clean up your compensation allocation. We’ve done this exercise many times, and we’ll walk you through our journey on how we helped a start-up clean up their comp strategy. Buckle up, as explaining this end to end takes two blogs!
Finish What You Start
A word to the wise, the exercise of cleaning up comp takes longer than you think. This can’t be done well in 1-2 weeks. If you start this, you might as well be thorough, you’ll need circa 4-6 weeks for base pay decisions alone, and you’ll soon see why. If you’ve amassed some decent headcount, we recommend you at the very least get some advice on this because handling comp poorly will lead to employee dissatisfaction and worse breakdown trust. This project requires A LOT of stakeholder management, and subject matter expertise to move you fast and in the right direction. This is one of those projects where you must finish what you started.
Why Bother
We won’t lie, this exercise is painful, but the outcome of knowing where you currently sit and want to sit in the market, aligning understanding, and creating more transparency leads to higher trust and optimal spend distribution, which in any climate, needs to be on point.
Additionally, pay transparency is becoming a legal matter on a larger scale. We’ve already seen the US ahead, issuing salary transparency laws across more and more states, and the EU Directive on pay transparency comes into force in 2024. It will make sense for UK businesses to be more transparent for many reasons. First to attract talent, but also for alignment where they have operations in the EU and/or US too.
Timing is Everything
There was a start-up who had been in the market for several years and had a sizeable hiring plan to budget for. They had historically created salary bands that they assigned to their levelling framework.
However, they had never thought about an end-to-end compensation strategy which was consequentially why they had several pain points. Some of which included:
- The Talent Team and certain line managers were claiming some pay bands they had was preventing sufficient hiring velocity in some departments.
- Some team members told us they were unhappy with their pay in comparison to others.
- Some people highlighted that they liked the transparency with the pay bands, but no one knew how equity was awarded.
- One leader believed other companies were dropping their salaries and/or were stalling pay increases because of the climate.
- Finance said they did not have an owner internally leading or knowing what data points to look at, and how to bring all this together for recommendations.
If by now you’re thinking ‘Oh dear this is us’, don’t panic. We bring you comfort because you are in the same boat as loads of start-ups out there. The good thing about the start-up here is that they recognised the challenge and prioritized looking into this.
Steps to Success
Step 1: Align On Terminology
We aligned terminology, so we were all on the same page, and we knew what we were prioritizing.
Compensation refers to the remuneration an employee gets in exchange for their work. It doesn’t just mean pay. It refers to all forms of pay, rewards, and benefits you offer. This can include base salary, bonuses, commission structures, equity, benefits, and other cash/non-cash perks/awards. And now you might be thinking, ‘there is way more to consider than I thought’, and you’re right! We prioritised deciding our position on base pay first, and after would tackle equity and rewards.
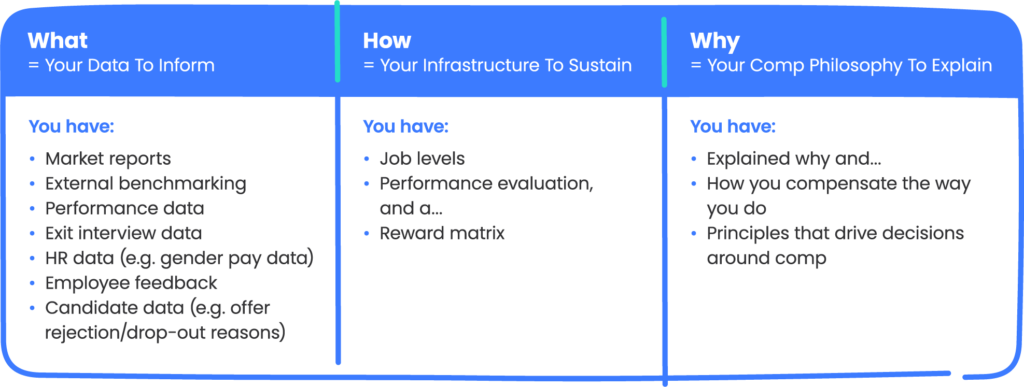
Step 2: Map Out What You Need
In a perfect world, we need the below mapped out and in operation. If we must fill in the blanks in places, we’ll tell you how this becomes an art, not a perfect science, and this is better than doing nothing.
Step 3: Assess Your Current State
We decided to use 2 external salary benchmarking tools. Choosing 1 is perfectly fine providing you select the right tool that has a dataset that includes the same roles you’re hiring for, and the data can be segmented by geography and/or valuation/company size.
The client already had selected Pave, but we also introduced Ravio since Ravio’s data covered the Series B to Series D start-up demographic and was free (joy!). New salary benchmarking tools are regularly coming to the market, and several allow early adopters to use them for free or on a paid subscription basis. These tools plug into your HRIS and access your data as part of contributing to building their dataset for comparisons. You then need to map your existing roles and levels to the tool’s own levelling structure. These tools make all their customers do this so there is accurate comparison. Some of these providers will help you map your current roles and levels to their levelling framework, but we strongly recommend you double check their mapping outcomes make sense to you and this takes time depending on your headcount size.
We then were able to see where each role sat in the market. This is showcased by percentiles. For example, the 50th percentile will show you the median salary in the market for that role. If you haven’t introduced a sophisticated levelling structure, this is likely implied by the roles and titles you have been offering. For example, you may have obvious role differences between Software Engineers and Lead Software Engineers in your company, you can still map your titles and roles by description to the benchmarking tool levels.
The example below is made up but shows what this can look like:
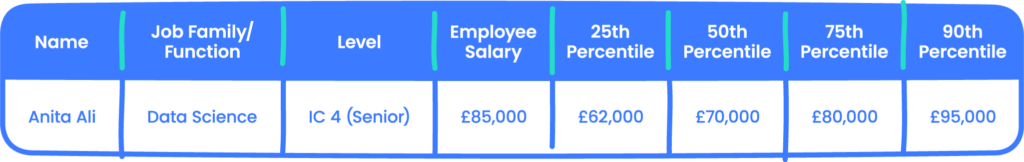
We even looked at live adverts, historical adverts, and from assessing their job descriptions we assigned the relevant Ravio and Pave level to their ads to see what other companies were paying percentile wise today, and if they had dropped salaries for certain roles due to the climate.
We asked our hiring managers where they wanted more talent from. We looked online to see what salaries those companies were paying for certain roles and collected that data. Internally, we were able to create a visual that showed where their salary bands were compared to those other companies. Finally, we looked at their employee leaver data, gender data, candidate offer decline and drop out reasons during the interview process. We also looked at relevant market reports on what is going on in the market regarding average pay rises and pay review trends.
Our deep dive discovered useful insights which included:
💸 Percentiles for Tech were not as competitive as the percentiles for Non-Tech.
💸 Some departments were being paid above their level and associated pay bands.
💸 We found pay parity regarding gender.
💸 A large percentage of leavers were paid in a low percentile.
💸 A very small percentage of leavers were paid north of 75th percentile.
💸 >75% of reasons for declining offers in certain roles were based on pay.
💸 For some of their roles the top of their salary band would correlate to the bottom of the salary range for the same role at companies they wanted to get talent from.
💸 We didn’t find evidence to suggest that companies had decreased their percentile ranges for Tech roles.
Step 4: Make Decisions On Base Pay
We were pleased to see that the use of salary bands had clearly supported gender pay parity across the company. We learned that the percentiles for Tech was probably because the market was moving quicker for Tech roles, and they were now at a certain percentile because they hadn’t updated their benchmarking. Where some departments were being paid above their bands, this was a clear indicator the bands were too low because they had to offer salaries aligned to the level above to get that talent. At least they had tested those bands quickly and the results were clear that band adjustments were needed for that function.
Regarding attraction and retention, pay is clearly linked to talent attraction. The more you pay, the more you’ll attract a wider spread of talent. However, it’s not always clear cut as to how much pay is linked to retention. While people may clearly state pay was the reason for leaving in an exit interview, a lot of answers may not say this. While the trigger may be something else (e.g. management, growth), it could be possible that the awareness of one’s lower pay could mean someone has a lower tolerance for any mistakes, being mismanaged, or recognition, and this could explain why there was a big correlation between those paid in lower percentiles and the number of leavers at this particular place. While people may leave because of another reason other than pay, it’s no surprise that often their new role does in fact pay more. Hypercontext’s Tech 2022 survey found that when employees believe they’re paid under market value, they’re 1.3 times more likely to apply for another job. It was no surprise a lot of people in the company had a strong sense of whether they were paid highly or not in the market based on messages they’d had from recruiters about other roles, the awareness of offer declines, and discussions they’d had with peers in the same roles outside the company.
Knowing what we knew, we discussed where they were competing for talent, losing talent, and what competitive (and in turn competitive salary) meant to them. The questions we thought about were ‘will we attract the talent we want to attract?’ and ‘Will we keep the talent we want to keep?’
We began discussing and deciding on a series of questions. Some of which included:
- What do we want our position to be regarding location pay?
- What percentiles do we want to pay for our roles?
- Do we want to keep raising the bar for talent?
- What other components do we/can we leverage in our compensation structure?
- What are our company goals over the next 12 months?
- What impact will the above answers have on our company?
- What’s the adjustment cost (if any) based on our answers to the above?
- When (if required) will we make any individual employee adjustments?
- How do we ensure, and guardrail adjustments are fair?
This helped them define their position on market-based and location-based pay and ensure fairness aligned with their attraction and retention needs. Once we had our answers, we were able to complete our analysis on reward, and finally bring all this together into a well-considered compensation philosophy!
Stay tuned for Part Two on…
Step 5: Reward
and
Step 6: Creating that Comp Philosophy
Do you need expertise and advice to execute this properly?
Book time with Beth directly here: https://calendly.com/bethdevelopa